

| ▲ Computer |
This was partly inspired by seeing an old video about Tektronix (http://www.vintagetek.org/vtek-videos/Y10HS.html) where they used a large two-dimensional resistor network to simulate the electric field within their electron guns.
The large resistor network was based on the fact that, in free space, the electric potential at any point must be the average of the potentials at adjacent points (this can actually be derived from the Laplace equation). If a flat, square grid is made out of resistors, with one resistor in the side of each grid cell, and voltages are applied to nodes of the grid to simulate the potentials at electrodes, the voltages of the nodes throughout the "free" points of the grid will automatically adjust themselves to satisfy the Laplace equation. Measurements can then be made of the voltages at each grid node, corresponding to the electric potential in free space. With careful design of the grid and electrode placement, it is possible to simulate a wide variety of electrode structures accurately. Additional tricks can be used to extend its range, such as wiring one edge of the grid back to the opposite edge, which simulates an infinite extent.
For an interesting brief overview of some field simulation techniques, have a look at this chapter from an old book (5MB PDF).
A physical resistor grid is obviously rather impractical. Fortunately, it is very easy to achieve the same result in software by using a 2D array. If array elements are initialized corresponding to desired electrode patterns and voltages, the software can run through each cell in the array and set its new value equal to the averages of the adjacent cells. After sufficient passes are made through the array, the values reach a steady-state at which point they can be read out.
The software described here uses this principle. At its heart, it uses two 200x200 arrays - voltage_array(0 to 199, 0 to 199) and mask_array(0 to 199, 0 to 199).
Each cell of voltage_array() corresponds to the electric potential at a particular point in space. Certain points, corresponding to electrodes with a fixed potential, are initialized to a chosen voltage, while others are free to float. The free-floating points are updated with each pass of the averaging algorithm through the array. To determine whether a particular cell corresponds to a fixed electrode potential or to a free space point (and, thus, whether the cell's value should be updated by the averaging algorithm), the corresponding cell of mask_array() contains a boolean value determining the cell's status. A True value corresponds to a fixed electrode potential, while a False value indicates a free space point. Note that, for the purposes of the software, the edge cells of the array are set to a fixed potential of 0V, and the averaging algorithm only updates the internal cells (i.e. those from coordinates 1,1 to 198,198). This avoids any problems with edge effects. However, one edge could easily be mapped to the opposite, as described above.
How are the arrays initialised? They are updated according to the pixel colours of a 200x200px bitmap image. This gives the greatest flexibility, since it is possible to draw any arbitrary shape and define any voltage. Here's how the software initializes the arrays.
If the pixel colour is pure white (RGB 255,255,255), the corresponding cell is set as a free-floating point, otherwise the cell is assumed to be at a fixed electrode potential, determined as follows. If the pixel colour contains only a red component (RGB values from 1,0,0 to 255,0,0), the voltage is positive and set equal to the red component. It can take a range from +1V to +255V. If the pixel colour is pure black (RGB 0,0,0), the voltage is 0V. If the pixel colour contains only a blue component (RGB values from 0,0,1 to 0,0,255), the voltage is negative and set equal to the negative of the blue component. It can take a range from -1V to -255V.
Using this method, any shape and voltage of electrode can easily be defined.
Once the arrays have been intialised, the averaging algorithm is then run and repeated around 500-1000 times to obtain a reasonably steady-state result. The software can then plot the equipotentials, electric field strength etc.
The software (VB6 source code and executable) is available here. When making the bitmap file to load, make sure you use a proper bitmap (*.BMP) file, not a compressed format like JPEG or GIF. The software is maybe a little bit rough around the edges, but it's functional. Have a play around with it. Here's a screenshot:
The graph in the bottom-right, and the "Export cross section" and "Draw cross section" buttons above it do a plot of the potential along a vertical line down the middle of the picture.
It might help to have a look at this video first to see what order to do things in:
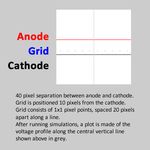
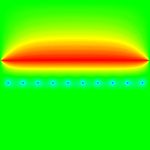
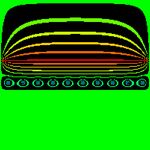
Here's an example of using the program to determine the cutoff potential for a triode grid arrangement. The first photo below shows the physical layout of the electrodes and their separation. Simulations are run at different values of the grid potential - in the four images below, the grid potential is -250V. The second photo is a 2x scale view of the image used to intialise the program. The third and fourth photos are the electric potential and equipotential lines, respectively. The behaviour near the left and right-hand edges of the image is beacuse the edge cells are set to 0V (see above). However, the center part is free from such edge effects and provides a valid simulation of the triode behaviour.
 |
 |
 Potential |
 Eqipotential lines |
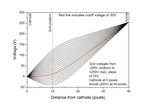
Here are graphs of the voltage and field strength versus distance from the cathode, and a graph of the surface field strength at the cathode versus the grid voltage. These are obtained from data measured along a vertical line down the center of the image, indicated by the grey line in the first photo above. You can clearly see how the grid voltage influences the voltage and electric field distributions. The grid cutoff voltage, where the field strength at the cathode surface is zero, is around 93V.
 Voltage vs. position |
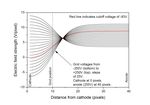 Field strength vs. position |
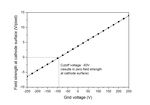 Surface field strength vs. grid voltage |
| ▲ Computer |